
[box type="info" align="alignright" class="" width=""]Please, read carefully.
Thanks to the feedbacks I have received, I reached to the conclusion that it's really hard to cover a topic like this one in the room of a blog post. So, I started writing a book about the STM32 platform. In the free book sample you can find the whole complete procedure better explained. You can download it from here.[/box]
In the first part of this series we've successfully setup a minimal yet working tool-chain to develop applications for the STM32 family (we've especially focused on STM32Nucleo developing board). We've based the tool-chain over the Eclipse IDE and the GCC cross-compiler for ARM Cortex platform. We've also created a test project (a simple blinking LED) and uploaded it on our Nucleo using the ST-Link Utility.
This might be enough to develop every type of application based on the STM32 family. Using the Nucleo integrated Virtual COM port, we could print messages to debug the firmware (this is the common way to debug Arduino sketches). However, we can use just few other tools to do a live debugging on our Nucleo, placing breakpoints, doing step-by-step debugging, accessing to internal registers and memory.
In this post we'll focus on how to use GDB to do step-by-step debugging. We'll configure it as client of another tool, which is able to interface the Nucleo through the ST-Link interface: OpenOCD.
Install OpenOCD
OpenOCD is a really challenging project started by Dominic Rath. OpenOCD has the aim to develop a sort of universal On-Chip-Debugger able to interface the most common MCU platforms on the market. OpenOCD is designed to interface ARM-Cortex-M processors and it provides drivers to connect to ST-Link debugging interface. OpenOCD is distributed as Open Source software. Freddie Chopin has created the precompiled version of this tool for Windows.
Before to start installing OpenOCD, I would like to say a few words about how OpenOCD works, especially when it's used to debug STM32 MCUs. I think that a knowledge of how the debug process works, even partial one, can be really useful to better understand how to customize the debugging environment.
[lightbox full="http://www.carminenoviello.com/wp-content/uploads/2014/12/OpenOCDarchitettura.jpg"]
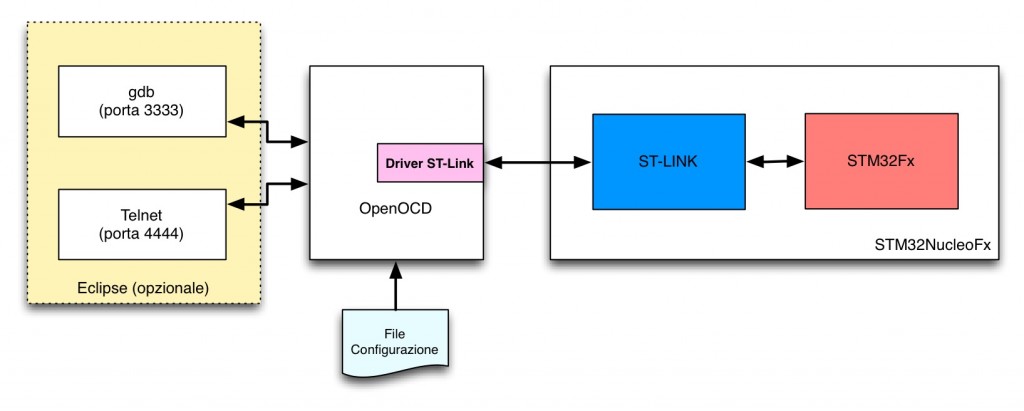
OpenOCD and ST-Link interaction
[/lightbox]
To flash a MCU (and eventually to debug it) we usually need an external piece of hardware called programmer (sometimes, they are also called dongle, on-chip programmer, etc). Every MCU manufacturer produces at least one type of programmer for a given MCU family. For the STM32 platform ST provides a family of programmers named ST-Link. The Nucleo board already integrates the ST-Link programmer (and it's even detachable from the main board and it can be used as stand-alone programmer). So we don't need any external hardware tool to flash our Nucleo MCU.
OpenOCD has all drivers needed to interface the ST-Link programmer and it's configured using some scripts file. These files contain commands that instruct OpenOCD to connect to the ST-Link interface of our Nucleo using the USB port and put OpenOCD in "server mode" on the 3333 TCP port. GDB will use this port to exchange commands with OpenOCD. Moreover, OpenOCD uses the additional TCP port 4444 to accept commands by the user through a telnet session. Thanks to these connections, OpenOCD can be instructed to upload the firmware on the target MCU, to setup breakpoints, to inspect memory status and so on. However, this work can be automatized and made simpler using Eclipse and the plug-ins we installed in the first part of this series.
Let's install OpenOCD. First we have to download the latest version of OpenOCD for Windows from here. I suggest to use at least 0.8 version or later, since I experienced several problem using the Nucleo with OpenOCD 0.7. The download file is a ZIP archive compressed using 7-zip utility. Extract the archive content inside the C:\STM32Toolchain directory. Next, rename the OpenOCD directory from openocd-0.8.0 to simply openocd. Next go inside the C:\STM32Toolchain\openocd\bin directory and rename the file openocd-0.8.0.exe in openocd.exe. [box type="note" ]This operation is not strictly needed. However, this will allow us to update OpenOCD when a new release is available without changing Eclipse configurations.[/box]
Setting up Eclipse
Once that OpenOCD is installed, we need to properly configure the Eclipse IDE to work with GDB and OpenOCD. There are two ways to configure Eclipse and OpenOCD:
- Method 1: the first method consists in configuring Eclipse so that it automatically starts first OpenOCD and then GDB at each debug session.
- Method 2: the second method consists in configuring OpenOCD as an External Tool that is started once, and then configuring GDB to connect to OpenOCD through the 3333 TCP port.
The plug-ins we installed in the first part of this series allow us to use both the configuration methods. However, I experienced some issues with the first method. Unfortunately, it often happens that OpenOCD can't connect to ST-Link debugger when it is repeatedly started/stopped. The only solution to this issue is removing the Nucleo board from USB port and connecting it again. I read around that is a problem related with the driver provided from ST. However, I wonder why this doesn't happen with the ST-Link Utility. I think that this is probably a issue related on how OpenOCD and ST-Link drivers interact. So, the best solution is to start once OpenOCD, and use GDB to connect to it using 3333 TCP port.
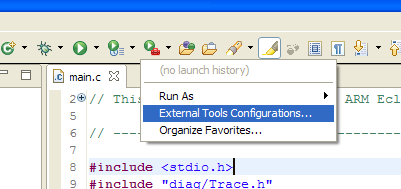
In the rest of this post I assume that you've already opened and compiled the test1 project made in the first post. Click the "External tools" configuration icon, and then click on "External Tools Configurations....", as shown in the following picture
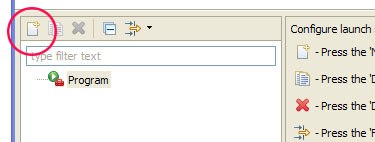
Now, click on the "New launch configuration" icon, as shown below
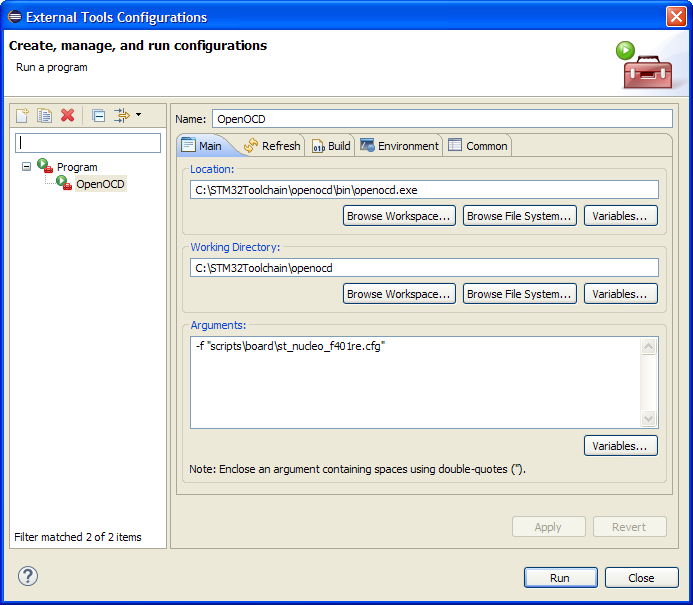
The configuration window shows. Fill the configuration fields as shown in the following picture: [lightbox full="http://www.carminenoviello.com/wp-content/uploads/2014/12/2014-12-25-10_39_45-External-Tools-Configurations.png"]
 [/lightbox]
This is the meaning of each field.
Location: is the absolute path where we have installed OpenOCD, that is C:\STM32Toolchain\openocd\bin\openocd.exe.
Working Directory: is the OpenOCD process working directory (that is, the cwd in UNIX operating systems). This path is used as base for paths in OpenOCD scripts and configuration files.
Arguments: are the arguments passed to the command line to OpenOCD. In our case we have to pass configuration script for our Nucleo board (my board is the STM32Nucleo-F401RE one; if you have a different Nucleo, check in C:\STM32Toolchain\openocd\scripts\board directory for the right configuration file).
What does the st_nucleo_f401re.cfg file exactly contain? It's a configuration script, which contains these commands:
|
1 2 3 4 5 6 7 8 9 |
# This is an ST NUCLEO F401RE board with a single STM32F401RET6 chip. # http://www.st.com/web/catalog/tools/FM116/SC959/SS1532/LN1847/PF260000 source [find interface/stlink-v2-1.cfg] source [find target/stm32f4x_stlink.cfg] # use hardware reset, connect under reset reset_config srst_only srst_nogate |
The first source command says to OpenOCD to load the configuration file for the ST-Link interface (pay attention that the ST-Link programmer embedded in the Nucleo has a different firmware version from the stand-alone ST-Link programmer). This other file contains the instructions to identify the right USB interface.
The other source command says to OpenOCD to load the configuration file that describes the STM32F4 MCU on the Nucleo board.
Click on "Apply" and then on "Run". You'll see these messages in the Eclipse console
|
1 2 3 4 5 6 7 8 9 10 |
Open On-Chip Debugger 0.8.0 (2014-04-28-08:39) Licensed under GNU GPL v2 For bug reports, read http://openocd.sourceforge.net/doc/doxygen/bugs.html srst_only separate srst_nogate srst_open_drain connect_deassert_srst Info : This adapter doesn't support configurable speed Info : STLINK v2 JTAG v23 API v2 SWIM v6 VID 0x0483 PID 0x374B Info : using stlink api v2 Info : Target voltage: 3.245204 Info : stm32f4x.cpu: hardware has 6 breakpoints, 4 watchpoints |
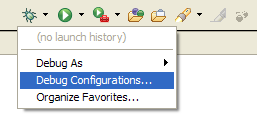
Moreover, LD1 LED (the one close to the mini-USB connector) starts blinking green/led. This means that OpenOCD has established the connection to the ST-Link debugger correctly. Now we need to configure GDB. Click on debug configuration menu and then "Debug Configurations...." like in the following picture:
 In the next window we need to select first "GDB Hardware Debug" entry and then click on "New launch configuration" icon
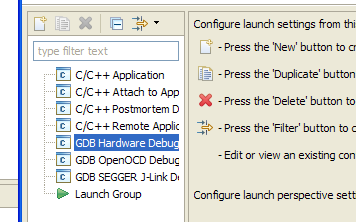 In the next windows you'll see a series of tabs (Main, Debugger, Startup, Source, Common). In the "Main" tab select "Enable auto build". [lightbox full="http://www.carminenoviello.com/wp-content/uploads/2014/12/2014-12-25-10_58_25-Debug-Configurations.png"]
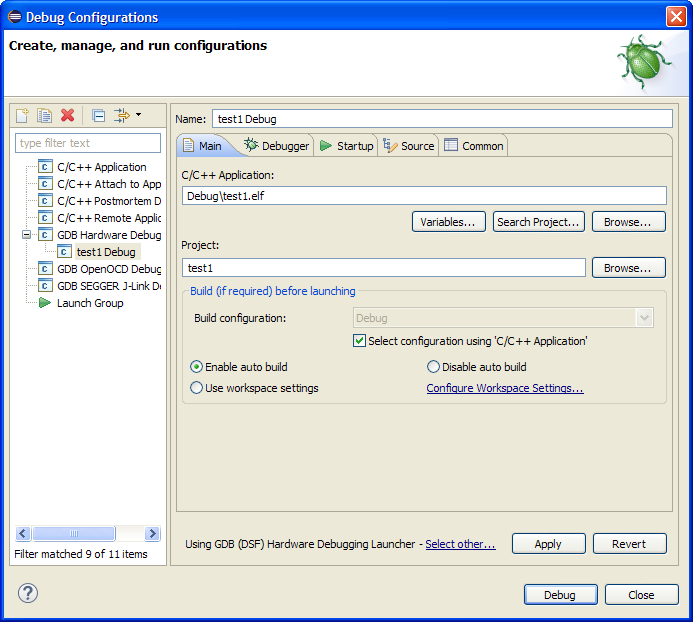 [/lightbox] In the "Debugger" tab configure field as shown in the following picture: [lightbox full="http://www.carminenoviello.com/wp-content/uploads/2014/12/2014-12-25-10_53_39-Debug-Configurations.png"]
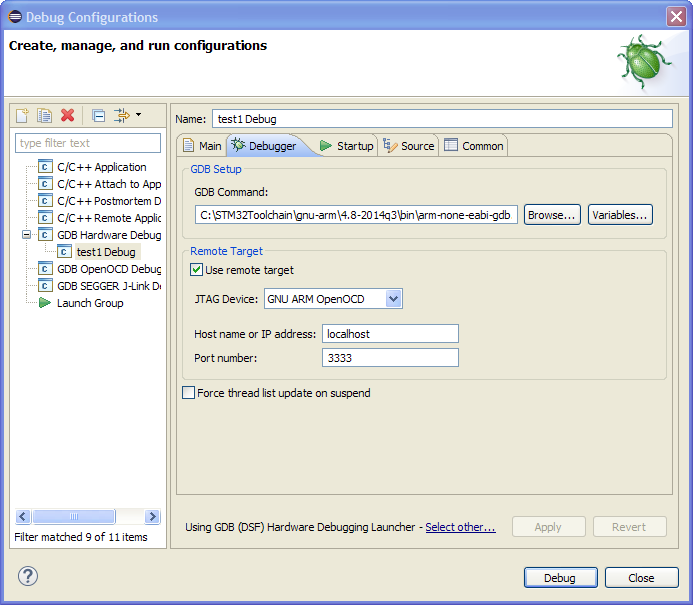 [/lightbox]
This is what each fields means.
GDB Command: is the path where GDB is installed. In our case is C:\STM32Toolchain\gnu-arm\4.8-2014q3\bin\arm-none-eabi-gdb.exe.
JTAG Device: is the programmer type we are using. Select "GNU ARM OpenOCD".
Host name e Port number: this field must be set to localhost and 3333.
Now go to "Startup" tab and configure each field as shown in the following picture: [lightbox full="http://www.carminenoviello.com/wp-content/uploads/2014/12/2014-12-25-10_54_02-Debug-Configurations.png"]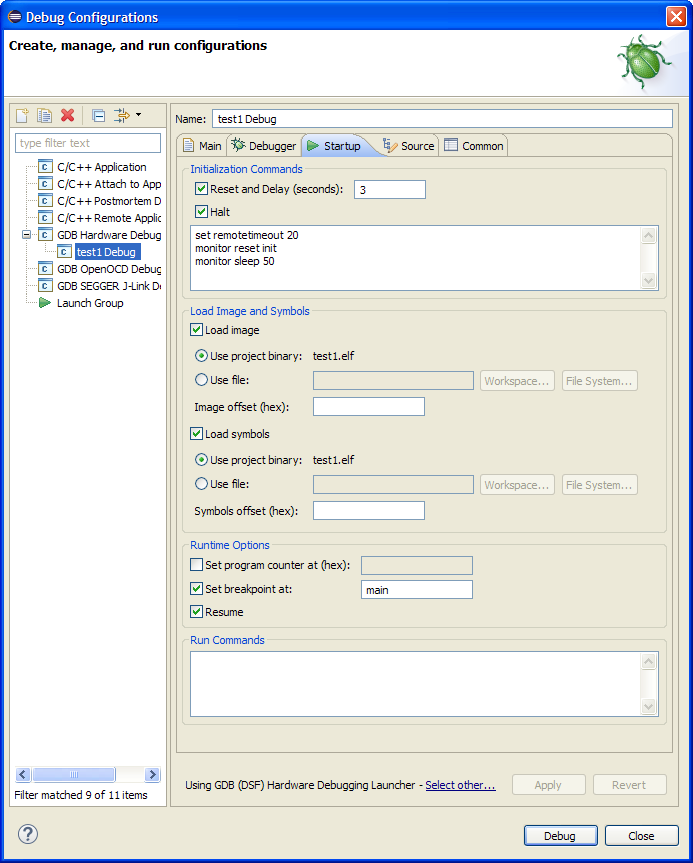 [/lightbox]
Click on"Apply" and then on "Debug". After few seconds, our test program will be loaded on the Nucleo. The execution will automatically stop at the main() function. We have successfully configured Eclipse to debug applications for our Nucleo board. I won't give details on how to setup breakpoints, to do step-by-step debugging, and so on. I assume you are familiar with these debugging instruments. In the next part of this series I'll show other debug related tools.
This article is part of a series made of three posts. The first part is here, the third here.
36 comments
Great job, thanks !
Well written, concise and efficient ! I've been trying to play with my Nucleo board, using a free toolchain (eclipse + gcc) on a Mac. And after struggling on finding relevant information, I found your blog and freshly written articles which helped me a lot. Not only, the steps are well described and working, but you also clearly explain the role of each step, so thanks.
I'm really happy that it helped you 😉
Hi,
Is there a way to use st-util using the OCD eclipse plugin just wondering to start st-util through debug config.
Hi,
I think that there is no way to use ST Util with OpenOCD, as it makes direct access ti ST-Link interface.
Hi, i have a problem with OpenOCD configuration. My nucleo is F411, and this version of OCD don't support my board. I find some directory for this nucleo, but eclipse shows runtime error.
at file "embedded:startup.tcl", line 58
at file "scripts\board\st_nucleo_f411re.cfg", line 8
i take st_nucleo_f411re.cfg from:
http://sourceforge.net/p/openocd/mailman/message/32831895/
I don't know what do now. ;/ I will be grateful if you helped, and thank for part 1 of your guide.
Hi perkx166
I have the same problem as yours with Nucleo F411
Then with the file I got from internet I had these errors :
Runtime Error: scripts\board\st_nucleo_f411re.cfg:6: invalid command name "C:/STM32F4/openocd//scripts/target/stm32f4x.cfg"
in procedure 'script'
at file "embedded:startup.tcl", line 58
at file "scripts\board\st_nucleo_f411re.cfg", line 6
I duclicate the 401 file in 411 file
I got these errors now :
srst_only separate srst_nogate srst_open_drain connect_deassert_srst
Info : This adapter doesn't support configurable speed
Error: libusb_open() failed with LIBUSB_ERROR_ACCESS
Error: open failed
in procedure 'transport'
in procedure 'init'
Thanks for your help
Jean
Hi,
now I overcame the problems of the first tutorial.
But now I'm encountered with the following messages. It seams the .elf file cannot be loaded.
Do you have a suspicion how to solf the problem?
.
.
.
Error: jtag status contains invalid mode value - communication failure
Polling target stm32f4x.cpu failed, GDB will be halted. Polling again in 6300ms
Error: jtag status contains invalid mode value - communication failure
Polling target stm32f4x.cpu failed, GDB will be halted. Polling again in 6300ms
Error: jtag status contains invalid mode value - communication failure
Polling target stm32f4x.cpu failed, GDB will be halted. Polling again in 6300ms
.
.
Or after a restart
Error starting process.
Cannot run program "C:\stm32tc\projects\teset12\Debug\teset12.elf": Launching failed
Cannot run program "C:\stm32tc\projects\teset12\Debug\teset12.elf": Launching failed
Cannot run program "C:\stm32tc\projects\teset12\Debug\teset12.elf": Launching failed
Thanks for your help
Max
Ummm, never seen this before. Just a question: which OpenOCD version are you using?
I use openOCD-0.8.0.
after further checking I found to things which might have been wrong:
in "External Tools Configurations", 'Program', 'OpenOCD', -
1) in the "main" tab I choosed for the 'location' "C:\stm32tc\openocd8\bin-x64\OCD8-64.exe" instead of "C:\stm32tc\openocd8\bin\openocd8.exe". (I thought this is the right .exe if I have a Windows 64bit)
2) in "External Tools Configurations", 'Program', 'OpenOCD', in the "Common" the small Window called 'Display in favourites menu' shows "external Tools" which was selected.
After correcting this two things and 'run' the project I get the following message in red letters:
Open On-Chip Debugger 0.8.0 (2014-04-28-08:39)
Licensed under GNU GPL v2
For bug reports, read
http://openocd.sourceforge.net/doc/doxygen/bugs.html
srst_only separate srst_nogate srst_open_drain connect_deassert_srst
Info : This adapter doesn't support configurable speed
Error: read version failed
in procedure 'transport'
in procedure 'init'
Which Windows version are you using? Some guys from ST reported me that there are some issues with Windows 8.x and some WinUSB drivers. Please, take a look here:
http://sourceforge.net/p/openocd/mailman/message/33444050/
Unfortunately, I don't have a recent Windows version to test.
I use Windows 7 Professional Service Pack 1
Hi,
I do not understand why to choose the GDB Hardware Debug instead of the OpenOCD Debug?
Max
All worked fine once I realised that I needed to set the working directory to:
C:\STM32Toolchain\openocd\scripts
not
C:\STM32Toolchain\openocd as stated in the text.
I am using openocd-0.9.0.7 which may be why it is different. Whatever the reason, it all works now - Thanks for providing such a useful tutorial.
Just wanted to thank you for putting this up. I just got the user LED on my Nucleo F411 to blink. Although I did not use Eclipse (used make + custom makefile), I found your series very much helpful. Especially the neat diagram about OpenOCD and ST-Link interaction.
Thanks again.
Hi Carmine,
I am really impressed with the work that you have done and I thank you for making things so simple and idiot proof. I have been struggling like hell to get support from the openst community, the guys there are really helpful but to a beginner like me, they speak a lot of gibberrish which I end up filtering for hours before I understand some of what they are saying. so for me to find a set of instructions like yours, it is very relieving.
but anyhow, I have gotten through your first tutorial, it seems there is a new release in openocd-0.9.0. the stm nucleo cfgs files have changed a bit, I have modified my external tools configurations to accomodate for this, inside the arguments is -f"scripts\board\st_nucleo_f4.cfg", my folder is exactly the same as yours. when I try to run, I get the following error in my eclipse console:
Open On-Chip Debugger 0.9.0 (2015-05-19-12:09)
Licensed under GNU GPL v2
For bug reports, read
http://openocd.org/doc/doxygen/bugs.html
Info : The selected transport took over low-level target control. The results might differ compared to plain JTAG/SWD
adapter speed: 2000 kHz
adapter_nsrst_delay: 100
none separate
srst_only separate srst_nogate srst_open_drain connect_deassert_srst
Info : Unable to match requested speed 2000 kHz, using 1800 kHz
Info : Unable to match requested speed 2000 kHz, using 1800 kHz
Info : clock speed 1800 kHz
Error: libusb_open() failed with LIBUSB_ERROR_NOT_SUPPORTED
Error: libusb_open() failed with LIBUSB_ERROR_NOT_SUPPORTED
Error: libusb_open() failed with LIBUSB_ERROR_ACCESS
Error: open failed
in procedure 'init'
in procedure 'ocd_bouncer'
can you tell me what I am doing wrong?
Hi Ovi,
It's certainly a issue related to libusb. This is a really common issue for Windows users. Which version of Windows are you running?
Try to have a look to zadig tool: http://zadig.akeo.ie/.
I've done some tests, and OpenOCD works well when Zadig tool reports that WinUSB is the driver for the ST Link Debug interface, as shown below
Hi there Carmine, thank you for your reply, I wish I checked with you sooner, would you mind dropping me an email next time you reply? would like to keep up to date with you.
well for now, I am using windows 8 operating system, I had been working on the openst system workbench eclipse workbench, but I have a bit of a deadline for a project (but I am still learning stm for work, so I need to become an expert in this)
so I decided to uninstall workbench and do your tutorials word for word.
I downloaded Zadig, but keep getting an error, I get ST link debug interface 0, not sure how to post an image here.
the error I get says "driver installation failed", I checked the logs in advanced mode and the last lines say the following:
Driver Installation: FAILED (Could not allocate resource)
libwdi:error [extract_binaries] failed to create file 'C:\Users\ovi2wise\usb_driver\.\installer_x64.exe' ([#00000020] The process cannot access the file because it is being used by another process.)
Using inf name: ST-Link_Debug_(Interface_0).inf
Could not extract files
Driver Installation: FAILED (Could not allocate resource)
libwdi:error [extract_binaries] failed to create file 'C:\Users\ovi2wise\usb_driver\.\installer_x64.exe' ([#00000020] The process cannot access the file because it is being used by another process.)
when I try clicking upgrade driver, im guessing my drivers are not good enough since zadig asks me to upgrade drivers, and im also guessing the mbed functionality has locked the USB somehow, maybe this is the problem im conflicting with eclipse?
please let me know if you have any solutions.
Kind regards
Ovi
Hi Ovi,
Unfortunately I've no direct experience with these types of issues. Looking to the log, it seems that another process is locking the self-extracting archive of drivers.
I would try another road. First uninstall completely the ST drivers from the Windows hardware device list. Then, reinstall the drivers downloading them from official ST website. Before you install the new drivers, unplug the Nucleo from the USB port.
P.S.: I added the ability to subscribe comments, so you can receive automatic updates by E-Mail 😉
Hi Carmine,
Thank you so much for the superb tutorial. I was able to create the connection with ST-Link Debugger and got my LED flashing green/red, however when I tried to run the debugger I've encountered a problem:
'Launching test1 Debug' has encountered a problem.
Error in services launch sequence
Unhandled exception when executing Sequence org.eclipse.cdt.dsf.gdb.launching.ServicesLaunchSequence@2baac116, step #1
org.eclipse.cdt.debug.gdbjtag.core.dsf.gdb.service.GdbJtagDebugServicesFactory.compareVersionWith(Ljava/lang/String;)I
I'm using the STM32F7 Discovery Board and I've set it up as your "Getting started with STM32F746G-DISCO" tutorial. What could be the problem?
Thank you so much!
Hi,
Unfortunately, I've never seen this error before. Looking to the Java exception, it seems that something doesn't perfectly match "in version". Try to see if there is something requiring an update in Eclipse (probably a CDT plugin). Go to Help->Check update menu.
Check also you have Java 8 or higher.
Hi Carmine,
Thanks for your suggestion, it was indeed the Java version. I forgot to point the eclipse.ini file to the correct Java installation on the machine. Thanks again for the awesome tutorial!
I noticed a number of comments here where people experienced an openOCD error, that ended with
"
Error: open failed
in procedure 'init'
in procedure 'ocd_bouncer'
"
(Before you do anything else: make sure the STLink utility is not still connected to the board! If it is, disconnect it: all LEDs on the board should be solid red! If they're not, disconnect and reconnect the mini USB cable and try again: if that didn't fix the problem: read on!)
I had this issue too on my ST32F429 discovery board.
Here's the fix that worked for me.
If you run the openocd command with the argument -d 2 (that's a debug level) and you see, towards the end of all the output, this line:
Debug: 252 2029 stlink_usb.c:1619 stlink_usb_open(): transport: 1 vid: 0x0483 pid: 0x3748 serial:
.. then you probably have found your issue!
It appears to be a USB VID/PID typo in in the file openocd\scripts\interface\stlink-v2.cfg.
Look a this line:
hla_vid_pid 0x0483 0x3748
Now check the debugger's real PD/VID: start Device Manager, select Universal Serial Bus devices, then select STMicroelectronics STLINK dongle, and go to (right click) properties. Select the 'Details' tab and select 'Hardware Ids' under 'Property'.
Carefully look at the PID VID: if is shows
USB\VID_0483&PID_374B&REV_0100&MI_00
you found your problem: the PID's last character is a 'B', while the openocd script shows an 8. Change the script file and make that 8 a 'B', save it, try again, and you're probably good to go!
(When I said 'typo' above, I'm not sure it is: maybe there are some (or most) STM32 boards out there that do have this different VID/PID. In any case, your script's VID/PID setting should match what Device Manager shows!)
~ Paul Claessen
Hi Carmine,
on the openOCD section, I followed from your book on page 148 where I launched conemu and typed in the 2 lines of code to execute openOCD, but I keep getting the error
Error: libusb_open() failed with LIBUSB_ERROR_NOT_SUPPORTED
then I realized that I am using 64bit, dont know if that makes a difference but I used
..\bin-x64\openocd.exe -f board\st_nucleo_f4.cfg
but I still get the same error
Error: libusb_open() failed with LIBUSB_ERROR_NOT_SUPPORTED
the full message is as follows:
> ..\bin-x64\openocd.exe -f board\st_nucleo_f4.cfg
Open On-Chip Debugger 0.9.0 (2015-05-19-12:09)
Licensed under GNU GPL v2
For bug reports, read
http://openocd.org/doc/doxygen/bugs.html
Info : The selected transport took over low-level target control. The results might differ compared to plain JTAG/SWD
adapter speed: 2000 kHz
adapter_nsrst_delay: 100
none separate
srst_only separate srst_nogate srst_open_drain connect_deassert_srst
Info : Unable to match requested speed 2000 kHz, using 1800 kHz
Info : Unable to match requested speed 2000 kHz, using 1800 kHz
Info : clock speed 1800 kHz
Error: libusb_open() failed with LIBUSB_ERROR_NOT_SUPPORTED
Info : STLINK v2 JTAG v28 API v2 SWIM v16 VID 0x0483 PID 0x374B
Info : using stlink api v2
Info : Target voltage: 3.255336
Info : stm32f4x.cpu: hardware has 6 breakpoints, 4 watchpoints
and the board is flashing but I cant type anything, like its non responsive. so I cant type telnet localhost 4444
can you please advise?
Usually that errors are generated by a conflict on the ST-LINK driver. Try the following procedure:
- Ensures the ST-Link debug interface is plugged on your PC
- Start the Device Manager (right click on your computer then select "Manage" then "Device Manager")
- Search for the "STMicroelectronics ST-Link dongle" device (it should be in the libusb-xxx category)
- Uninstall the device, checking the "Suppress the driver for this device" box
- Unplug the ST-Link debug interface
- Download and install the ST-Link driver if needed
- Plug the St-Link debug interface
If this doesn't solve your issue, try to follow the instructions at pg.150 in the book.
Hi Carmine,
I uninstalled and reinstalled the drivers getting the exact same error, but this time Zadig worked, but still the same errors. the versions on the USB installation is the same as the one in thebook.
there is one weird error that I came across, I tried to update my st_link firmware but everytime I tried to connect the device, it said that no device was detected. the ST-link pops up just fine in my event manager though. not sure how to proceed.
regards
The ST-LINK Utility is able to detect the board? Is the "ST-LINK Dongle" peripheral listed in the Device Manager?
the ST-LINK still lists under peripherals, tried using ST-LINK utility, it doesnt detect device when I try to connect. checked up online, some people have had similar issues, they are saying that its bricked?
Try to reset the stlink interface to factory defaults, as described in this post:
http://www.carminenoviello.com/2016/02/26/restore-st-link-interface-bad-update-2-26-15-firmware/
Follow especially the part regarding interface reset.
Hey Carmine, I did reset, its got the old firmware in it. st-link utility still struggles to connect. I reset while in settings now and then and the device appears shortly. then it disappears and says no ST-LINK detected
Hard to say what could be the issue. I'm almost sure that it's related with drivers installation. Try to remove drivers from the device manager, remove the USB cable from the nucleo and reinstall them.
I have a nucleo f411re at the office with its own st-link. I wanna go get it, what should I do to avoid bricking that one as well?
I figure if I can avoid making the same mistake, I can continue with programming. I tried uninstalling everything. tried downloading everything again and reprogramming it. but same issues happen. everytime I want to connect, it tells me that the st-link is not detected.
I'm sure that your Nucleo is not bricked. It's a matter of drivers.
However, if at work you have another Nucleo and, more important, another PC, try to configure that PC. Install ST-LINK drivers first, and connect the other Nucleo to see if it's recognized by the PC. If so, then test the apparently broken Nucleo to see if the PC recognize it.
ah... you are correct. connected it to my laptop and installed the drivers, worked fine, connected to target and all.
tried uninstalling the drivers on my computer and then reinstalling, but I get the same problems. any suggestions? anything in registry I should clear maybe?
would prefer working on my PC
ok, so as an update to my last message, I did the following:
I went into my list of programs and uninstalled anything to do with my st-link v2 which included the following:
stm32 st-link utility
(I left stm32cubemx since it only generates files)
windows driver package - stmicroelectronics (usbser) ports...
windows driver package - stmicroelectronics (winusb) stlinkwinusb...
some of these did not want to uninstall because they were missing some VCP file, I couldnt see the address because it had a ~
next I did the following:
went on cmd as admin (win+x - cmd(admin)) - this may be unnecessary
typed: SET DEVMGR_SHOW_NONPRESENT_DEVICES=1
and then went to device manager and started browsing for all drivers related to my st-link v2, these included the following drivers:
-universal serial bus devices -> st-link debug
-ports(com & lpt) -> stmicroelectronics stlink virtual com port
-portable devices -> nucleo
-disk drives -> mbed microcontroller usb device
after all that, I downloaded just the st-link utility, the utility included the drivers for the st-link v2 and also offers the ability to update the firmware. I would recommend that when installing programmer, you should just download the st-link utility and it will in turn install all of the 3 required software (drivers, st-link utility and firmware upgrade)
its working now, I can connect to the programmer and I see the contents of my microcontroller!
I could connect,load & run the code
---> Stop at Main()
stm32f4x.cpu: target state: halted
target halted due to debug-request, current mode: Thread
xPSR: 0x01000000 pc: 0x08000a38 msp: 0x20020000
---> After few minutes
Error: jtag status contains invalid mode value - communication failure
Warn : target stm32f4x.cpu is not halted
Polling target stm32f4x.cpu failed, trying to reexamine
Examination failed, GDB will be halted. Polling again in 100ms
Info : Previous state query failed, trying to reconnect
Polling target stm32f4x.cpu failed, trying to reexamine
Info : stm32f4x.cpu: hardware has 6 breakpoints, 4 watchpoints
Anyone had experienced this ??